BREEZE INTELLIGENCE
Every buyer at the under-tack show sees the same clock. ThoroughByte goes deeper — our model synthesizes 20+ data points from each breeze into a single 0–100 score, normalizing for environmental variables and isolating the true athletic signal — delivered before sale day.
WHAT WE BUILT
Every horse that breezes at an under-tack show generates data far richer than the clock time posted on the board. ThoroughByte captures multiple performance dimensions from each breeze and runs them through a composite model that accounts for environmental noise, sex-specific baselines, and distance benchmarks.
The output is a single score (0–100) and a tier classification — ELITE, STRONG, ABOVE AVG, AVERAGE, BELOW AVG, or WEAK — that tells you where a horse stands relative to the entire sale population. No opinions. No pedigree bias. Just the athletic signal extracted from the breeze itself.
Pedigree page and a clock time. No context for track variant, session depth, stride mechanics, or environmental conditions.

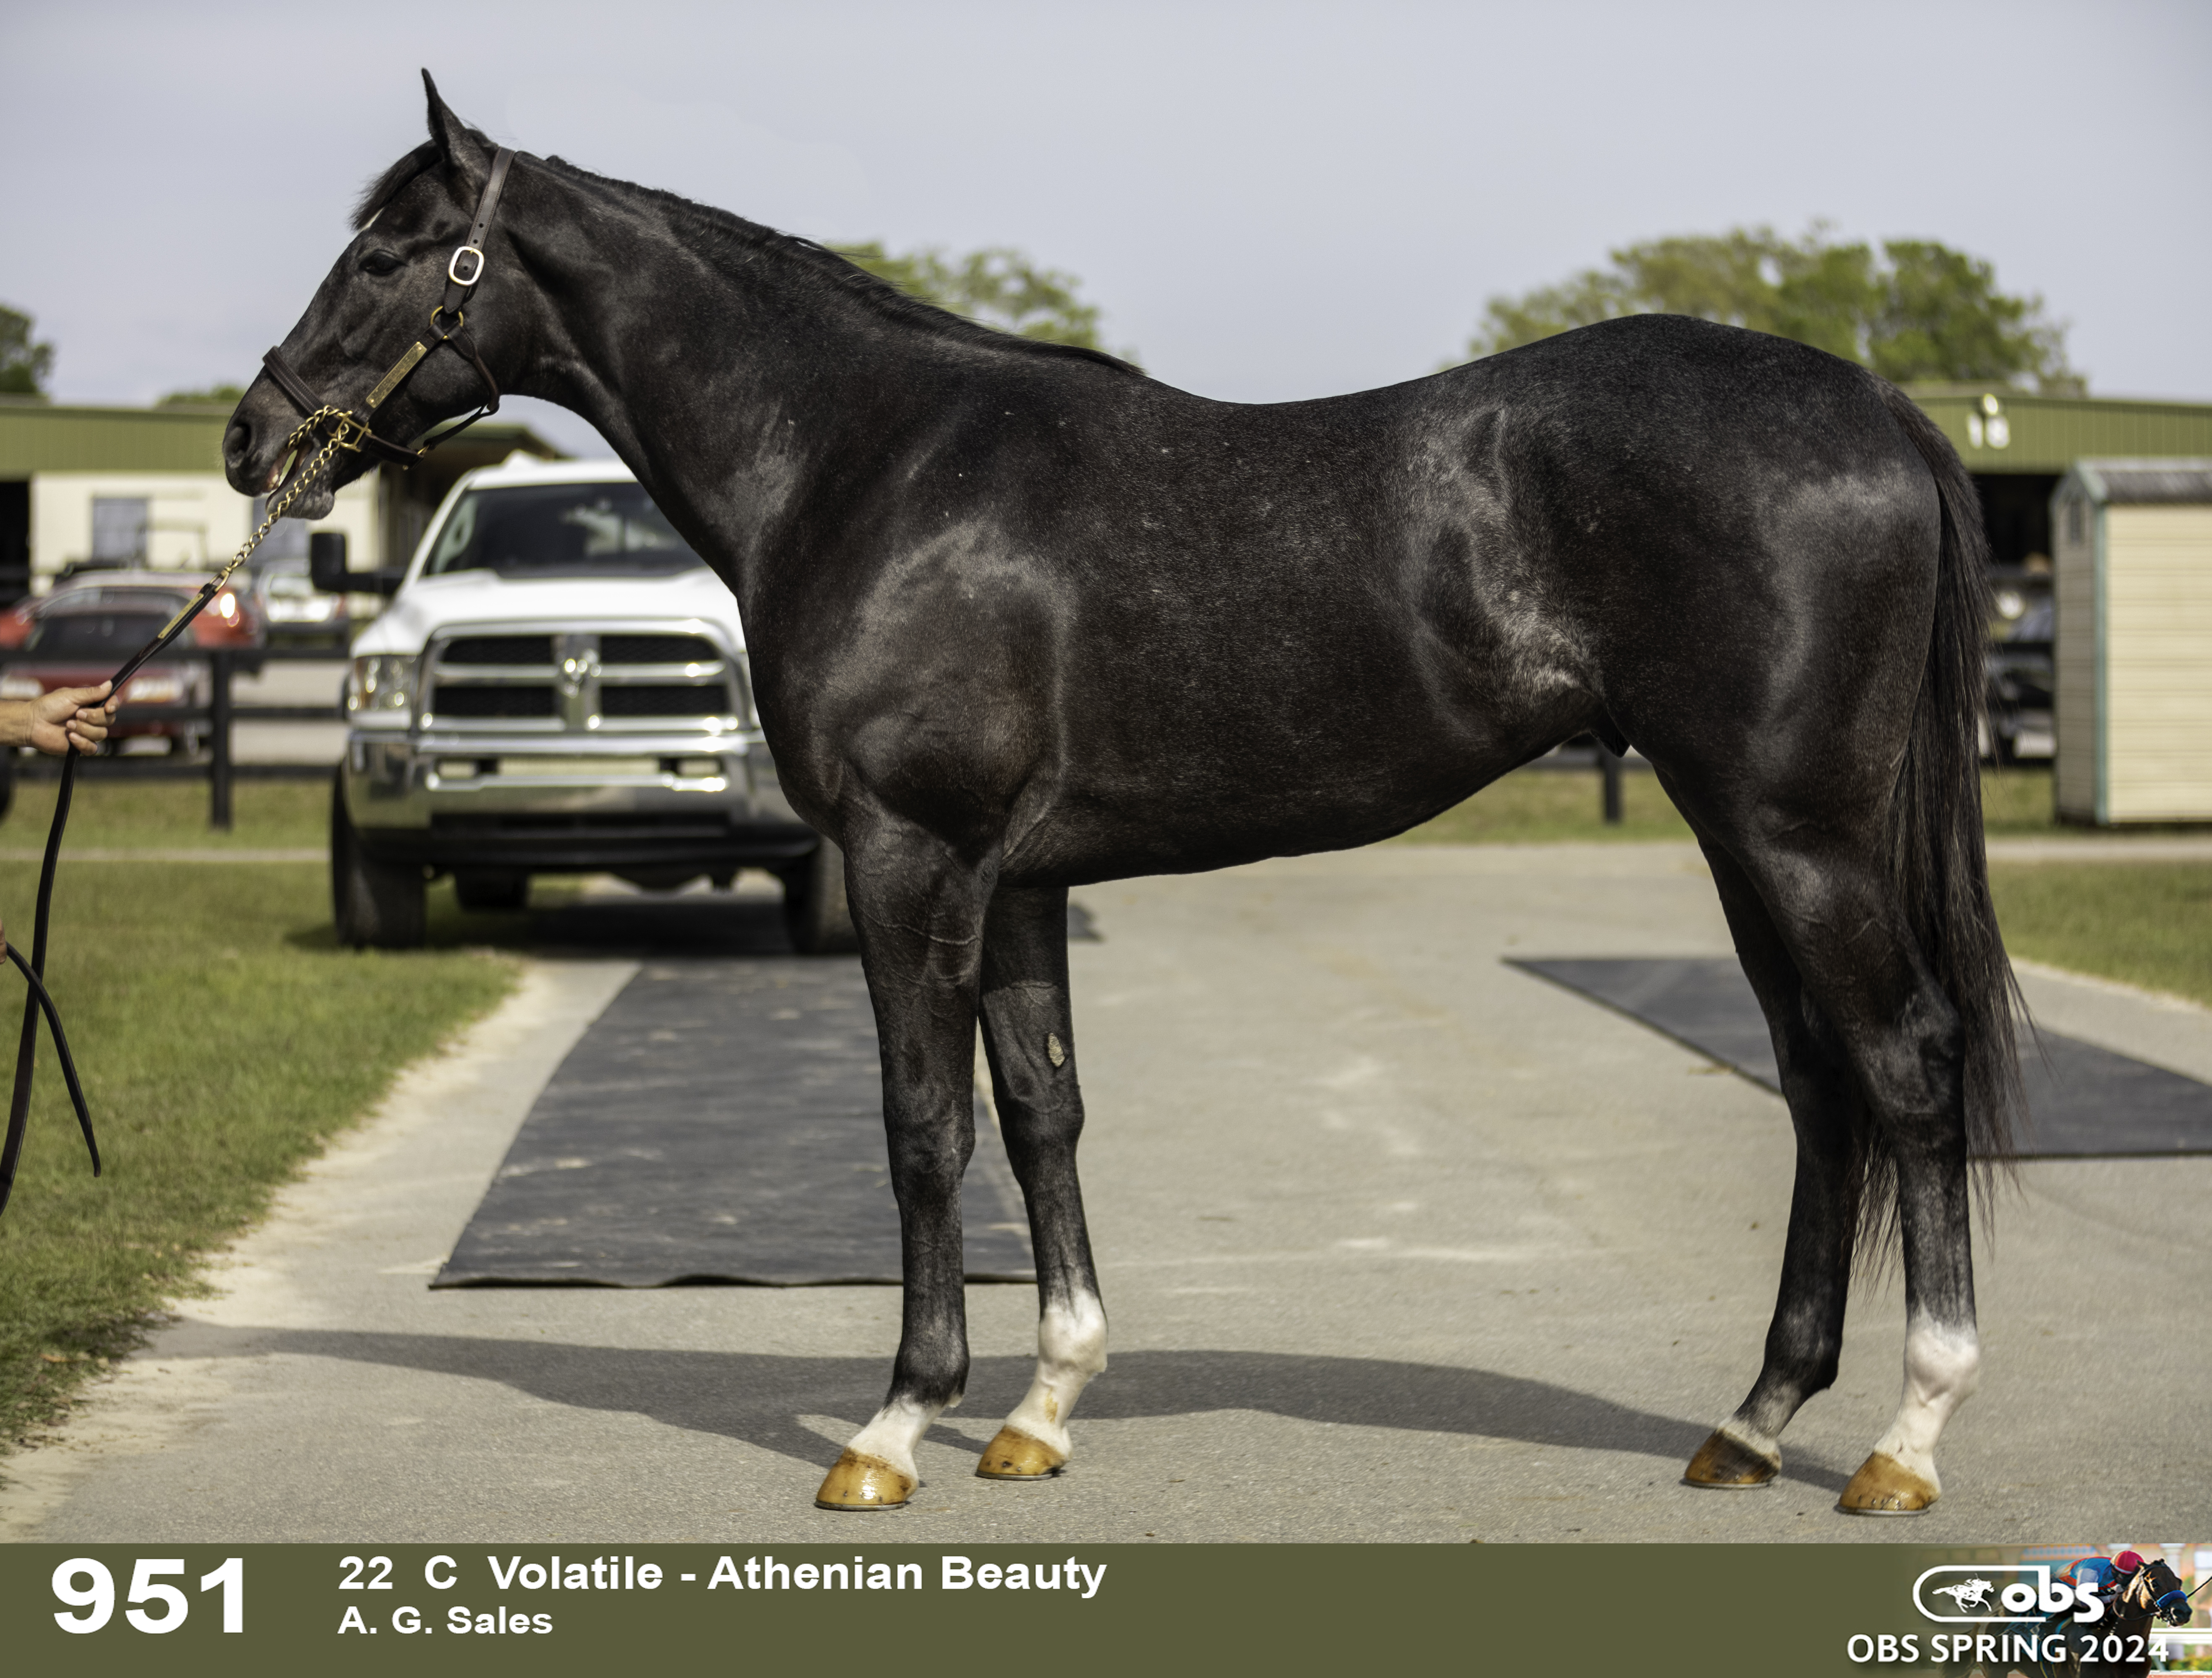
This Volatile colt posted a well-above-average breeze, placing in the top 22% among the 483 colts who breezed 1/8 mile at this sale. At 10.1s, the breeze time came in 0.2s quicker than the 10.3s average. A standout feature: the 25.7-foot stride was among the longest in the group (avg 24.8′), suggesting an efficient mover. Deceleration through the gallop-out clocked at 11.74s, better than the 12.1s peer average — indicating the horse was still running hard past the wire.
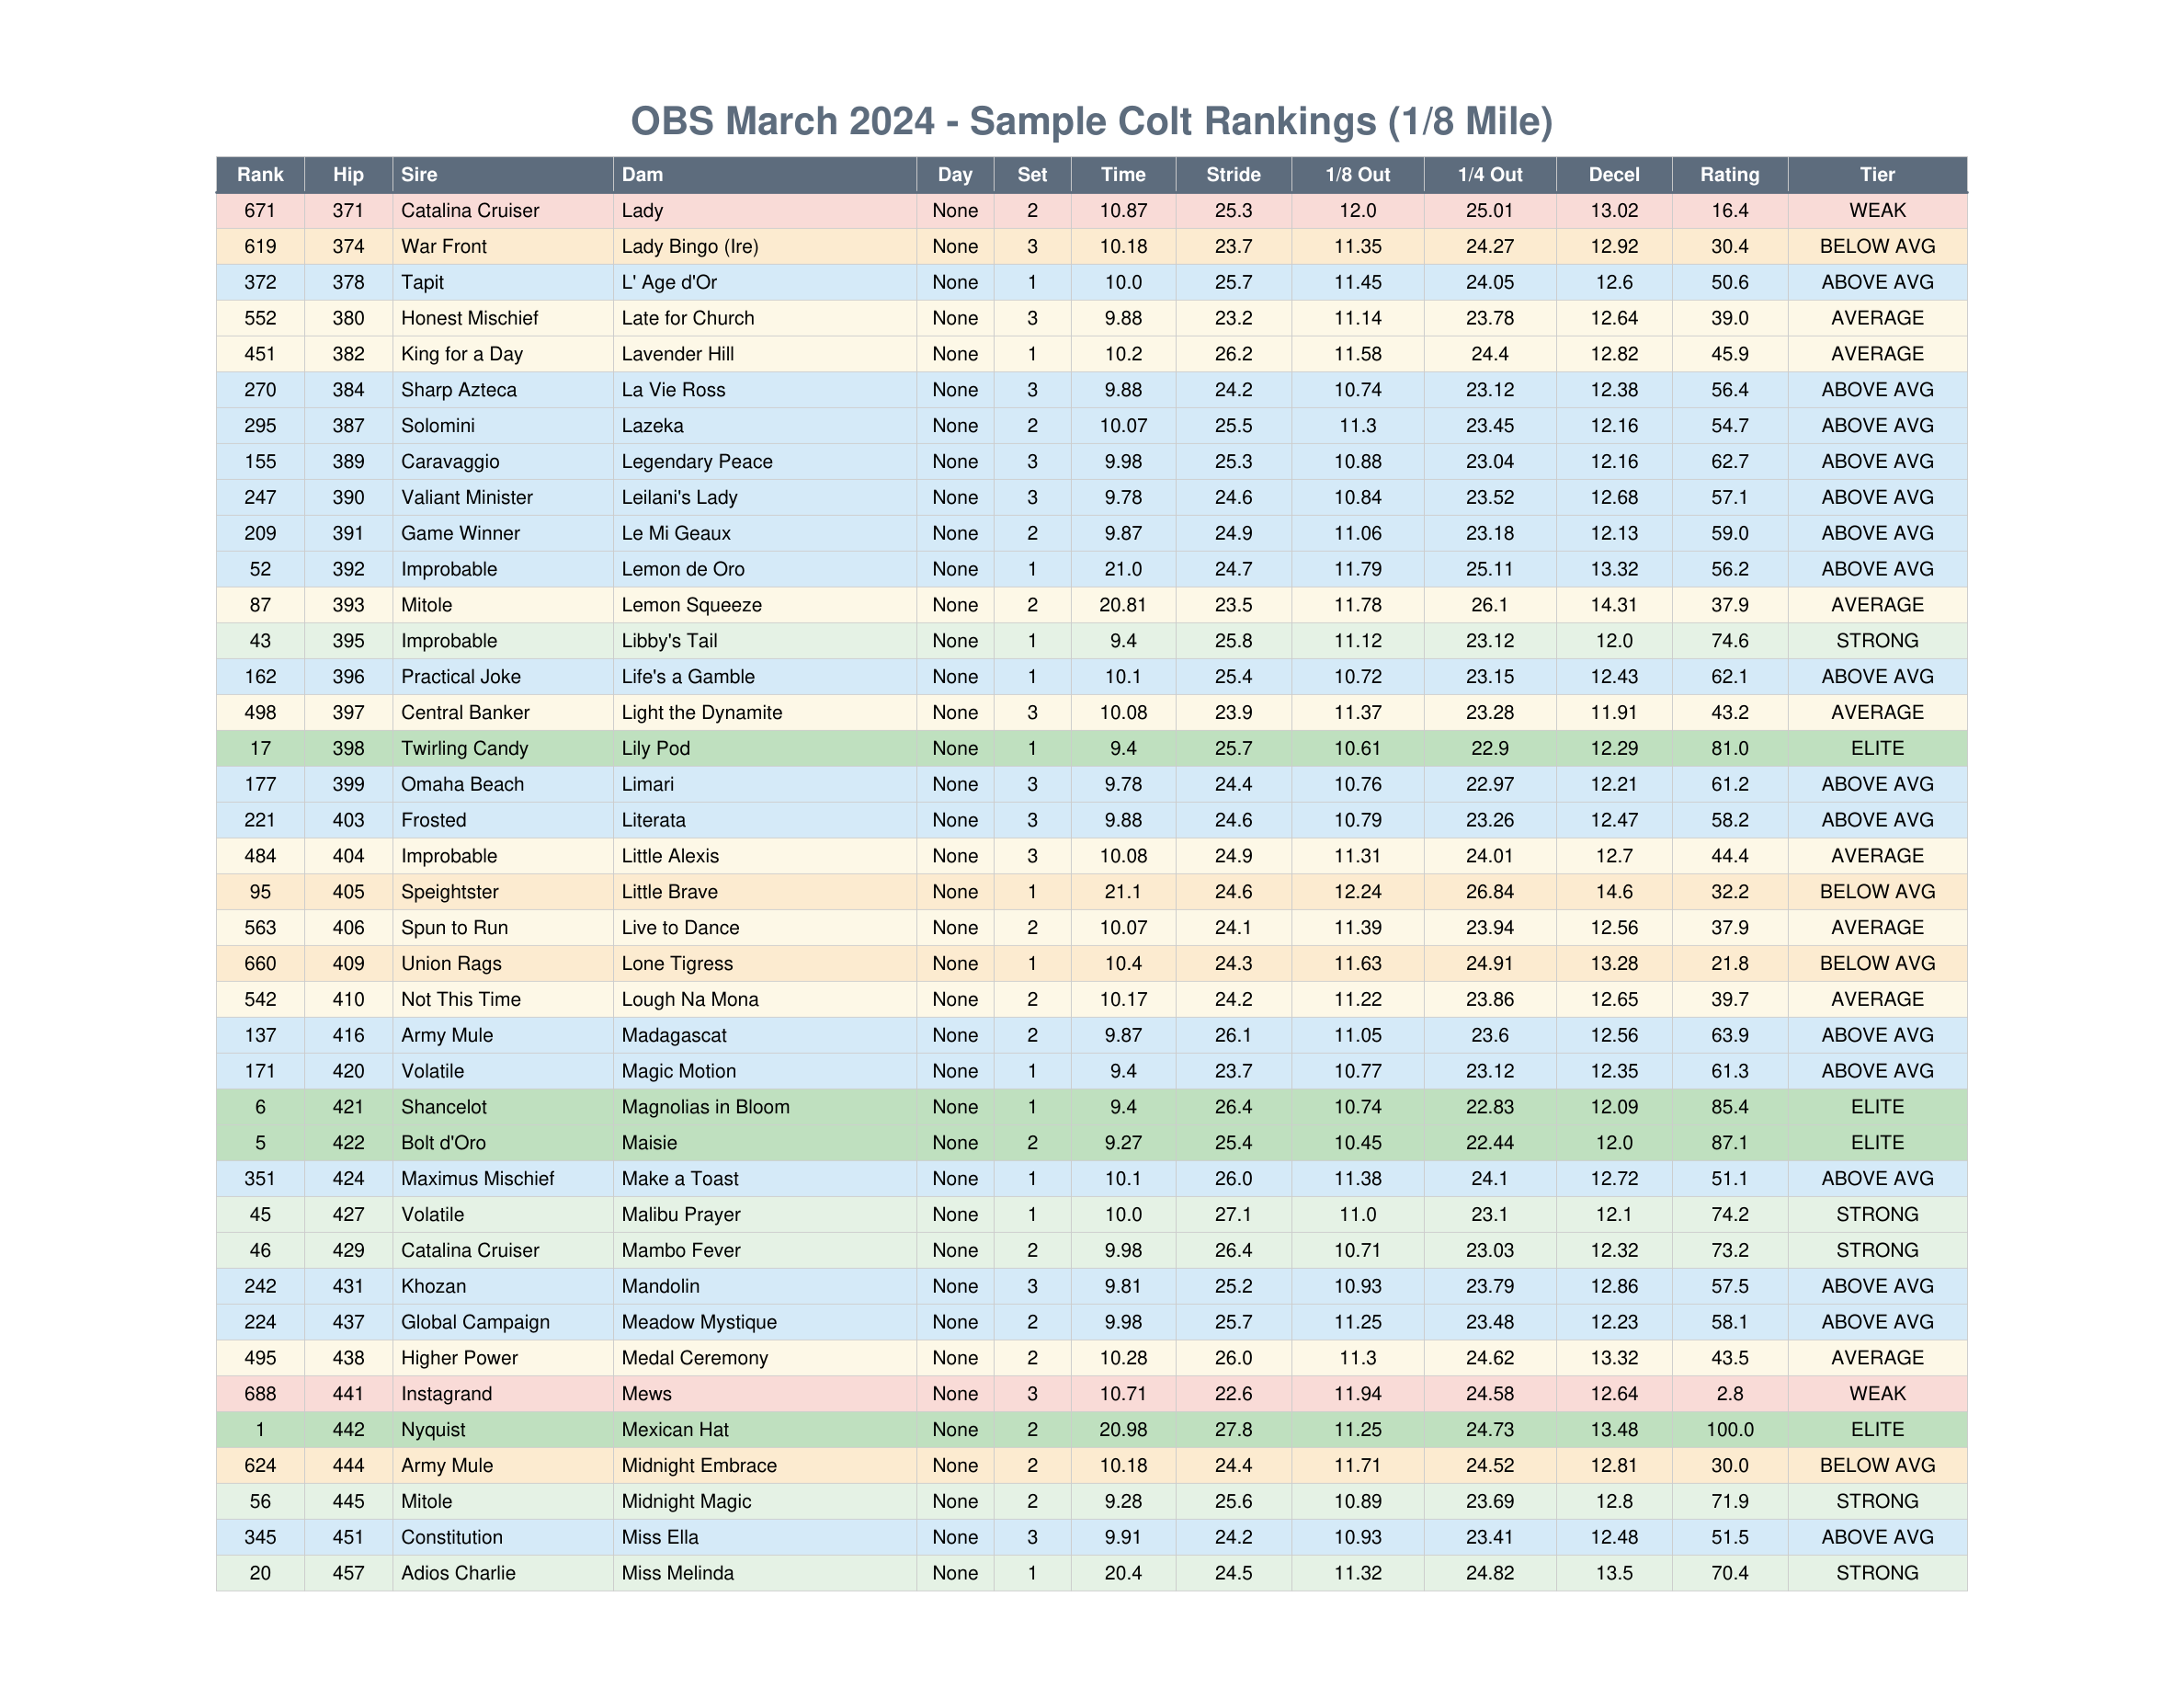
Compared against 483 colts who breezed 1/8 mile at OBS April 2024.
THE PROOF
We tracked 1,474 horses from the 2024 OBS March and April sales through 18 months of racing. Every rating was generated before any horse entered a starting gate. Here's what happened.
ELITE horses earned $137,780 on average — 8.3x the $16,536 earned by WEAK.
Percentage of starters that won at least one race.
Stakes-quality performance drops from 31% (ELITE) to 0% (WEAK).
34 of 47 Graded Stakes Winners came from our top two tiers. Just 1 from BELOW AVG or WEAK.
Graded Stakes Winners from ELITE + STRONG
These two tiers represent only 24% of the population but produced 72% of the graded stakes winners.
Horses binned into deciles by algorithm score. The top decile averaged $119K with 25 stakes winners.
YOUR EDGE ON SALE DAY
Not the night before, not the morning of the sale. As the breeze show unfolds, every horse that worked is scored, tiered, and sorted within sex and distance cohorts. Generate individual horse cards for the prospects you care about, or explore the full ranked list with Elite access. Either way, you have data before the sale ring opens.
Search by hip number to pull up any horse and generate a detailed profile card with score, tier, and a written scouting summary. On the Elite plan, open the full interactive ranked list — sort by any column, filter by tier or cohort, isolate state-breds, and export the whole thing as a PDF.
A :10.1 breeze on Day 1 is not the same as a :10.1 breeze on Day 3. It may not even be the same as a :10.1 breeze three sets later on the same morning. Track conditions shift constantly — and not always in the same direction. A sealed surface that started deep and cuppy can dry out and turn fast by midmorning. The next day, a freshly harrowed track might ride fast early and deteriorate as hundreds of horses churn through it. Weather changes between sets. Moisture levels shift.
ThoroughByte normalizes for all of it: session depth, track variant, set-to-set surface changes, and environmental conditions. The model doesn’t assume conditions move in one direction — it measures which direction they actually moved and adjusts accordingly.
Walk into the sale ring knowing the difference between a horse the market priced correctly and one it didn’t. ThoroughByte won’t replace your eye or your experience — it gives both of them better information to work with.
FINDING ALPHA
A “Market Miss” is a horse rated ELITE or STRONG that sold for $100K or less but went on to earn $100K or more on the track. In 2024, the algorithm flagged 36 of them.
This is exactly the kind of horse ThoroughByte is built to surface before the sale ring prices it correctly. Every horse in the table below was algorithmically flagged as high-rated at a time when the market had not yet recognized the value. The data was generated before any of these horses ever entered a starting gate.
| Horse | Sire | Tier | Score | Sale Price | Earnings | Return |
|---|---|---|---|---|---|---|
| Speed King | Volatile | STRONG | 68.6 | $100,000 | $830,190 | +730% |
| Bam’s Bliss Kiss | Solomini | STRONG | 70.4 | $95,000 | $286,290 | +201% |
| Naughty Rascal | Rogueish | STRONG | 72.2 | $39,000 | $243,975 | +526% |
| Starship Impulsive | Improbable | STRONG | 72.3 | $50,000 | $218,210 | +336% |
| In My Memories | Jimmy Creed | STRONG | 77.3 | $40,000 | $212,934 | +432% |
| Artislas | Catalina Cruiser | STRONG | 75.0 | $100,000 | $209,500 | +110% |
| R Morning Brew | Curlin’s Honor | STRONG | 79.3 | $30,000 | $188,842 | +530% |
| Mrs Worldwide | Global Campaign | ELITE | 80.7 | $100,000 | $173,350 | +73% |
| R Pretty Kitty | Instilled Regard | STRONG | 70.3 | $30,000 | $142,693 | +376% |
| Powdered Sugar | Gift Box | STRONG | 66.2 | $95,000 | $135,440 | +43% |
THE PLATFORM
The ThoroughByte platform powers every tier — from free horse cards to the full Elite suite.
Individual horse cards with breeze time, stride length, gallop-out, deceleration, percentile rank, and a written scouting summary. Downloadable as PNG.
All PlansEvery consigner scored and tiered using Bayesian-adjusted racing outcomes, volume reliability, and market validation. Know which barns are producing runners — not just sale-toppers. See the methodology →
Pro & EliteEvery horse scored 0–100 and tiered. Sortable and filterable by hip, score, tier, percentile, stride length, deceleration, sire, and state-bred designation. Exportable as PDF.
EliteAggregate breeze metrics by stallion across the entire sale. See which sires are producing the highest-rated athletes.
EliteBTW, BTP, and BTProd flags on every ranked horse, so pedigree context is visible alongside the athletic data.
EliteAlgorithmic markers where ThoroughByte’s athletic rating significantly exceeds expected market price based on historical consignor and sire median sale data.
EliteFull-sale breakdown: tier distribution, average metrics per tier, and cohort comparisons by sex and distance.
ElitePRICING
Start free with 3 horse card lookups. Upgrade when you’re ready for more.
forever
per sale
per year
per year
QUESTIONS?
Have questions about which plan is right for you? We’re here to help.